
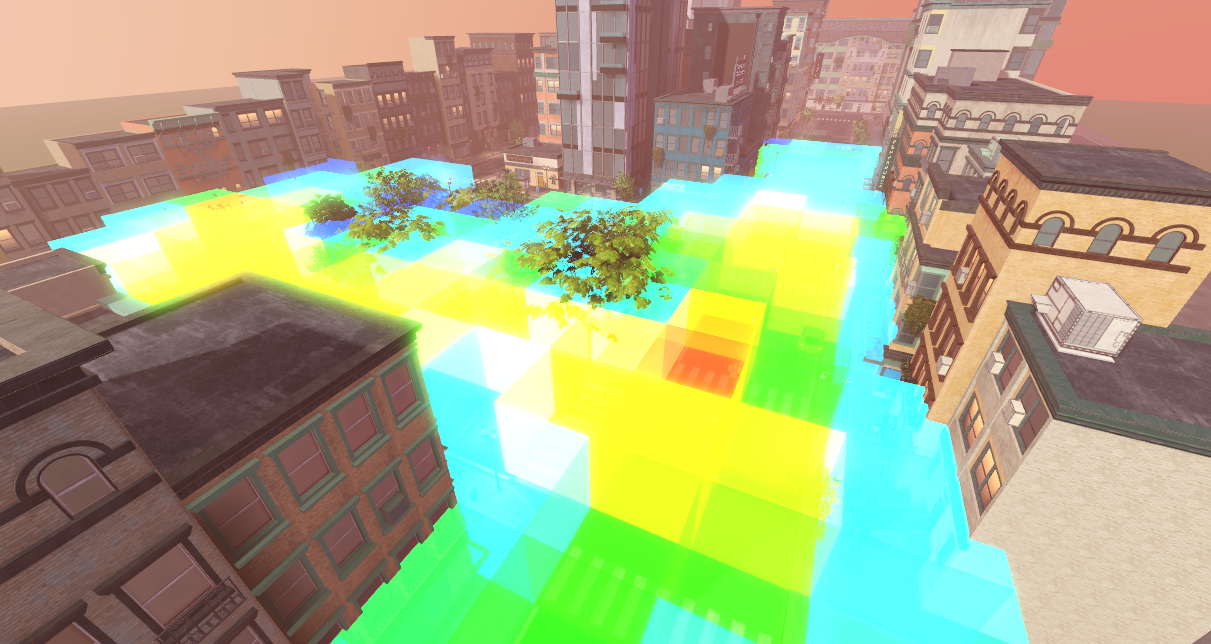
Understanding how players move through a Roblox experience can reveal things that ordinary analytics often cannot.
A developer may know how many players joined, how long they stayed, whether they completed an objective, or whether they purchased an item. But that still leaves an important question unanswered:
What were players actually doing inside the map?
Where did they spend their time? Which routes did they naturally follow? Which areas were ignored? Did players use the environment in the way it was designed?
That is the problem BulkBrains Heatmap is designed to help solve.
BulkBrains Heatmap is a player movement analytics system for Roblox developers that records spatial activity inside an experience and converts that data into visual heatmaps. It is designed to give developers a clearer picture of how players interact with the physical layout of their games.
The system consists of a Roblox Studio plugin, a backend analytics pipeline, and a web-based dashboard for viewing and managing heatmap data.
The BulkBrains Heatmap Roblox Studio plugin is available through the Roblox Creator Store, while the plugin source code is also publicly available on GitHub.
Why Spatial Analytics Matter
Most game analytics are event-based.
A player joins.
A player clicks a button.
A player completes a level.
A player purchases an item.
A player leaves.
Those events are useful, but they do not necessarily explain what happened between them.
Consider two players who each spend ten minutes inside the same Roblox experience.
One player may explore almost the entire map, interact with several areas and repeatedly move between different locations.
Another player may spend nearly the entire session inside one small section of the environment.
From the perspective of session duration, the two players look similar.
From the perspective of level design, they are completely different.
Spatial analytics add another layer of information by recording where activity happens inside the game world.
This allows developers to investigate questions such as:
- Which areas of the map receive the most traffic?
- Which areas are rarely visited?
- Where do players naturally gather?
- Which routes are used most often?
- Are players taking unintended shortcuts?
- Are important areas being overlooked?
- Do players become stuck or concentrated in particular locations?
- Does a redesigned area actually change player behaviour?
For large environments, this type of information can be difficult to obtain through manual observation alone.
How BulkBrains Heatmap Works
At a high level, BulkBrains Heatmap converts the Roblox game world into a spatial grid.
As players move throughout an experience, their position contributes activity to the relevant grid cells.
Instead of storing movement only as individual coordinates, the system can aggregate activity spatially.
Over time, cells that receive more player movement accumulate more activity than cells that are rarely visited.
This data can then be visualised as a heatmap.
Areas with heavy player activity become immediately visible, while areas receiving little or no activity remain comparatively quiet.
The result is a visual representation of how the playable environment is actually being used.
Rather than looking through thousands or millions of individual position samples, developers can inspect a single heatmap and quickly identify larger movement patterns.
Grid-Based Player Tracking
The underlying idea is deliberately straightforward.
A Roblox map exists in three-dimensional world space.
BulkBrains Heatmap divides that space into cells and determines which cell a player’s position belongs to.
For example, a player’s position might be represented by Roblox as something similar to:
X = 153.4
Y = 12.0
Z = -86.7
The heatmap system does not necessarily need to treat that exact coordinate as a unique point.
Instead, the position can be associated with a spatial cell covering a defined area of the map.
Multiple nearby player positions therefore contribute to the same cell.
This has several advantages.
It reduces the amount of data required to describe player behaviour, makes aggregation easier, and creates a format that can be efficiently converted into a visual heatmap.
The size of those cells also has an important effect on the resulting analytics.
Smaller cells provide greater spatial detail.
Larger cells provide a broader overview while reducing the number of individual cells that need to be tracked.
That balance between resolution and data volume is one of the key considerations when designing a spatial analytics system.
Turning Movement Into Useful Data
Raw position tracking by itself is not particularly useful.
The real value comes from aggregation.
Imagine a player walking repeatedly through a corridor.
Each time the player’s position falls inside the cells making up that corridor, those cells receive additional activity.
Now imagine hundreds or thousands of players using the same environment.
Patterns begin to emerge.
A busy entrance may become one of the most active parts of the map.
An intended secondary route may show almost no usage.
A shortcut that was never deliberately designed may appear as a strong line through the heatmap.
A decorative area that took significant development time may show almost no player activity at all.
These patterns are often difficult to recognise from individual sessions but become obvious when movement data is aggregated.
Roblox Studio Integration
BulkBrains Heatmap is designed to fit into the Roblox development workflow rather than existing as a completely separate analytics system.
Developers can install the BulkBrains Heatmap plugin from the Roblox Creator Store and use it as part of their normal Roblox Studio development process.
The goal is to make spatial analytics something that can be incorporated into iteration.
A typical workflow might look like this:
- Build or update part of a Roblox experience.
- Configure Heatmap tracking.
- Publish the updated experience.
- Allow real players or testers to use the game normally.
- Collect player movement data.
- Open the BulkBrains Heatmap dashboard.
- Inspect movement patterns.
- Modify the map based on the findings.
- Collect another dataset.
- Compare player behaviour after the change.
This creates a development loop based not only on intuition, but on observed player behaviour.
Using Heatmaps for Level Design
One of the most useful applications of player movement heatmaps is level design.
When building an environment, developers usually have an intended player flow in mind.
Perhaps players are expected to enter through a lobby, move toward a central area, discover an objective, and then continue deeper into the map.
But players do not always behave as expected.
A doorway may be difficult to notice.
A path may look unimportant.
A wall or object may unintentionally discourage movement.
Players may discover a shortcut.
A decorative feature may attract far more attention than intended.
Heatmap data can reveal these differences between intended behaviour and actual behaviour.
If a major area of the map receives almost no player activity, the developer can investigate why.
The solution might be architectural.
It could involve moving an entrance, widening a path or changing the layout.
It could be visual.
Perhaps the area needs better lighting, signage or environmental cues.
It could also be gameplay-related.
Maybe players simply have no meaningful reason to visit that area.
The important point is that the heatmap provides evidence that there is something worth investigating.
Analysing Player Flow
Player flow is one of the most difficult aspects of game design to judge purely from within Roblox Studio.
Developers already know where everything is.
They know which doorway leads where.
They know the intended route.
They know which object is important.
Players do not.
That difference makes it easy for developers to overestimate how obvious a design is.
Movement analytics can help expose that gap.
If players consistently choose one route over another, the heatmap makes that visible.
If players repeatedly move back and forth in the same area, that may suggest confusion.
If a supposedly important route receives little traffic, it may not be as discoverable as intended.
Heatmap analytics can therefore become a useful complement to playtesting.
Identifying Bottlenecks
Heatmaps can also reveal bottlenecks.
A bottleneck occurs when many players are concentrated into a small area because the environment or game mechanics force them through the same location.
Sometimes this is intentional.
A narrow entrance may create a useful gameplay moment.
In other situations, it may indicate a problem.
For example, a busy spawn area may become congested because players have too few ways to leave.
A doorway may be too narrow.
A queueing system may create unnecessary crowding.
A route between two popular areas may become disproportionately busy.
By looking at movement density, developers can quickly identify these high-pressure areas and decide whether they are desirable.
Discovering Unused Areas
One of the more uncomfortable findings a heatmap can reveal is that players simply do not use part of a map.
Large environments frequently contain areas that required significant time to build but receive very little player interaction.
Without spatial analytics, this may not be obvious.
Developers may continue adding content to an area because they assume players are already using it.
A heatmap can challenge that assumption.
If a large section of an environment has very little activity, developers can ask whether it should be improved, repurposed, simplified or removed.
This can be especially useful when deciding where future development effort should be spent.
Comparing Map Changes
Heatmaps become particularly powerful when used comparatively.
Suppose a developer believes that an area of the map is difficult to discover.
The layout is changed.
A doorway is enlarged.
Lighting is improved.
An objective is moved closer to the entrance.
The developer can then compare movement patterns before and after the update.
If traffic into that area increases, the change appears to have influenced player behaviour.
If nothing changes, the underlying issue may be somewhere else.
This gives developers another method for evaluating design changes beyond subjective judgement.
A Tool for Testing
BulkBrains Heatmap does not have to be used only on large live experiences.
It can also be valuable during development and testing.
A team could enable heatmap tracking during internal playtests and ask testers to explore a new environment without giving them detailed instructions.
The resulting movement data could reveal whether testers naturally discover the intended areas.
This is particularly useful because player movement can expose issues that testers may not explicitly report.
A tester might never say:
“I subconsciously avoided the left side of the room because the entrance did not look important.”
But the movement data may still show that almost every tester made the same decision.
Data Volume and Scalability
Player movement analytics can potentially generate large amounts of data.
A game with hundreds of active players updating their exact position continuously could create an enormous dataset.
That is why aggregation is an important part of the BulkBrains Heatmap design.
Instead of treating every movement sample as permanent standalone information, the system can work with aggregated grid activity.
This allows the amount of stored analytics data to remain more manageable while still preserving the movement patterns developers care about.
BulkBrains Heatmap uses a usage-based approach tied to the amount of spatial data being processed rather than requiring developers to immediately commit to a large fixed analytics package.
This makes it practical for smaller projects to experiment with spatial analytics while still allowing the system to scale with larger experiences.
Privacy and Analytics Design
Movement analytics should collect what is necessary for the analytical task without collecting unrelated information.
The purpose of BulkBrains Heatmap is to understand activity inside a game environment.
The important information is therefore spatial behaviour: where activity occurred and how frequently particular areas were used.
The system is intended around analysing aggregated player movement patterns rather than creating a tool for watching individual players.
For most development decisions, aggregated behaviour is far more useful anyway.
A developer usually wants to know that 70% of movement follows one corridor rather than manually reviewing the route taken by a particular player.
Open Source Roblox Plugin
The Roblox Studio component of BulkBrains Heatmap is open source.
The source code is available in the BulkBrains Heatmap GitHub repository.
This allows developers to inspect how the plugin works, understand the integration, report issues and contribute improvements.
Open sourcing the plugin also makes the relationship between the Roblox experience and the Heatmap platform more transparent.
Developers who are considering integrating an analytics tool into their game can inspect the code rather than relying entirely on a closed implementation.
For technically minded Roblox developers, the GitHub repository provides a useful starting point for understanding how the Heatmap integration works.
Where the Different Parts Live
BulkBrains Heatmap currently has three main entry points.
BulkBrains Heatmap Dashboard
The web interface for accessing and managing Heatmap data is available at:
https://console.bulkbrains.com/heatmap
This is the main BulkBrains Heatmap application.
Roblox Creator Store
The Roblox Studio plugin can be installed directly through the Roblox Creator Store:
Install BulkBrains Heatmap on Roblox
This provides the Roblox Studio side of the Heatmap integration.
GitHub
The plugin source code is available publicly at:
BulkBrains/Heatmap-Plugin on GitHub
Developers can inspect the source, follow development or contribute to the project.
What Types of Roblox Experiences Can Use Heatmaps?
Spatial analytics can be useful across a wide range of Roblox experiences.
Open World Games
Large environments are particularly difficult to evaluate manually.
Heatmaps can show which regions players actually explore and which remain largely unused.
Roleplay Games
Roleplay environments often contain many buildings, rooms and public spaces.
Movement analytics can reveal which locations become natural gathering points.
Obbies
Heatmaps can identify where players repeatedly fail, hesitate or abandon a route.
PvP Games
Movement concentration can reveal commonly used positions, routes and choke points.
Racing Games
Heatmaps can highlight common racing lines and areas where players leave the intended route.
Simulators and Tycoons
Developers can analyse how players move between upgrade areas, resource locations and interaction points.
Social Experiences
Heatmaps can reveal where players naturally congregate, which can help with the design of social spaces.
Lobby and Hub Areas
Large lobby environments often contain portals, menus or entrances to different game modes.
Heatmaps can help developers understand which parts of those hubs receive attention.
Heatmaps Should Support Design, Not Replace It
Analytics should not be treated as a substitute for game design.
A highly trafficked area is not automatically well designed.
A low-traffic area is not automatically a failure.
There may be deliberate reasons for either.
The purpose of a heatmap is to provide additional information.
Developers still need to interpret that information in the context of their game.
For example, a hidden area may intentionally receive very little traffic.
A dangerous zone may be designed to discourage players.
A central lobby may naturally dominate the heatmap because every player starts there.
Heatmaps become useful when developers combine the data with an understanding of the game’s design goals.
From Assumptions to Evidence
Game development involves countless assumptions.
Players will notice this doorway.
Players will follow this path.
Players will understand this layout.
Players will visit this building.
Players will use this shortcut.
Some of those assumptions will be correct.
Others will not.
BulkBrains Heatmap provides a way to test them.
Instead of relying entirely on what developers believe players are doing, spatial analytics provide another source of evidence.
That does not remove creativity from game development.
It simply gives developers better information.
Getting Started
BulkBrains Heatmap is now available for Roblox developers.
To start using it:
- Install the BulkBrains Heatmap plugin from the Roblox Creator Store.
- Configure Heatmap for your Roblox experience.
- Begin collecting player movement data.
- Visit the BulkBrains Heatmap dashboard to work with your heatmaps.
- Use the resulting data to investigate how players interact with your map.
Developers interested in the technical implementation can also view the BulkBrains Heatmap source code on GitHub.
See Where Your Players Actually Go
Every player moving through a Roblox experience creates information about the design of that environment.
Where they walk.
Where they stop.
Which routes they prefer.
Which areas they avoid.
Where they gather.
Which parts of the map they never discover.
BulkBrains Heatmap turns that activity into something developers can see.
If you are building a Roblox experience and want to better understand how players interact with your map, you can get started today with BulkBrains Heatmap.
Build your map. Collect the data. See where your players actually go.
Install BulkBrains Heatmap on Roblox →
Leave a Reply